While slit lamp biomicroscopy is an incredible tool to evaluate the front surface of the cornea, it cannot detect subtle changes in the corneal curvature needed for diseases such as keratoconus or other forms of corneal ectasia. For that reason, the introduction of corneal topography represented a true revolution in the diagnosis and management of corneal diseases.
While the name “corneal topography” is actually a misnomer, in that most of the systems actually measured slope and produced derived curvature maps, it has persisted since the technology was introduced in the 1980s. Since then, we have seen the release of corneal tomography, an advanced diagnostic tool that provides additional information for physicians by assessing both the anterior and posterior cornea.
This article explains the value of corneal tomography and reviews the latest devices on the market.
EVOLUTION OF CORNEAL TOMOGRAPHY
Corneal topography systems utilize algorithms for surface reconstruction of an acquired reflection image from Placido photokeratoscope images. The Placido disc was developed in the late 1800s as a tool to assess the cornea by analyzing the reflection of a set of concentric rings focused on the anterior corneal surface. The Placido disc image was reflected off the tear film-air interface to provide a reflected pattern that revealed the anterior corneal shape. This imaging technique was utilized by many topography systems to provide a Placido-reflected image of the cornea as well as a computerized quantitative assessment of the corneal surface. Stephen D. Klyce, PhD, is credited with developing color-coded maps and indices from quantitative analysis of numerous points on the corneal surface to generate maps for evaluation in the office.1
The drawback of Placido-based systems became the inability to know what was happening on the posterior surface of the cornea. Scheimpflug imaging was developed using a rotating camera to photograph corneal cross-sections illuminated by slit beams at different angles to improve upon the deficiencies of Placido-based imaging. This method allowed for greater accuracy and resolution in creating a 3-D map of the cornea that assesses both the anterior and posterior corneal surface, along with thickness readings at various points throughout the cornea. As the reconstruction of the cornea provides more information, the term “tomography” replaced topography as it is more reflective of 3-D characterization of the cornea compared to just reporting on surface topography.
Corneal tomography is a more advanced diagnostic tool because its Scheimpflug imaging takes photographs of the anterior and posterior cornea. As a result, the posterior cornea can be visualized, which can be abnormal in early onset keratoconus or early post-LASIK ectasia. Many types of corneal tomographers are on the market; the two common machines available in the United States that offer Scheimpflug technology are the Pentacam (Oculus) and the Galilei G4 or G6 (Ziemer Ophthalmic Systems AG).
PENTACAM
The Oculus Pentacam provides a Scheimpflug image, which is a cross-sectional image showing the cornea, anterior chamber, iris and lens. A 3-D representation of the patient’s corneal shape is also provided. The density of the cornea is evaluated using densitometry, which is an objective measurement of light scatter in the cornea. Any densitometry value less than ~30 is considered normal; thus, a condition resulting in decreased corneal clarity (eg, corneal edema) increases the densitometry value. A cataract creates an abnormal densitometry reading for the visual system as well. In addition, the Pentacam report includes a convenient summary of the keratometry, pachymetry and other numeric measurements. A pachymetry color map indicates corneal thickness.
Clinical uses of corneal tomography
Corneal tomography is useful in evaluating corneas in the following clinical situations:
- Screening for refractive surgery to find patients that are contraindicated to laser vision correction surgery
- Screening for keratoconus in eyes where vision is not completely correctable with spectacles or soft contact lenses
- Planning cataract surgery to address astigmatism management
- Managing astigmatism following keratoplasty
- Evaluating ocular surface disease (ie, pterygium, Salzmann’s nodule, corneal dystrophy)
- Following patients with keratoconus or corneal ectasia to address progression
- Following patients after collagen crosslinking to address treatment success or failure
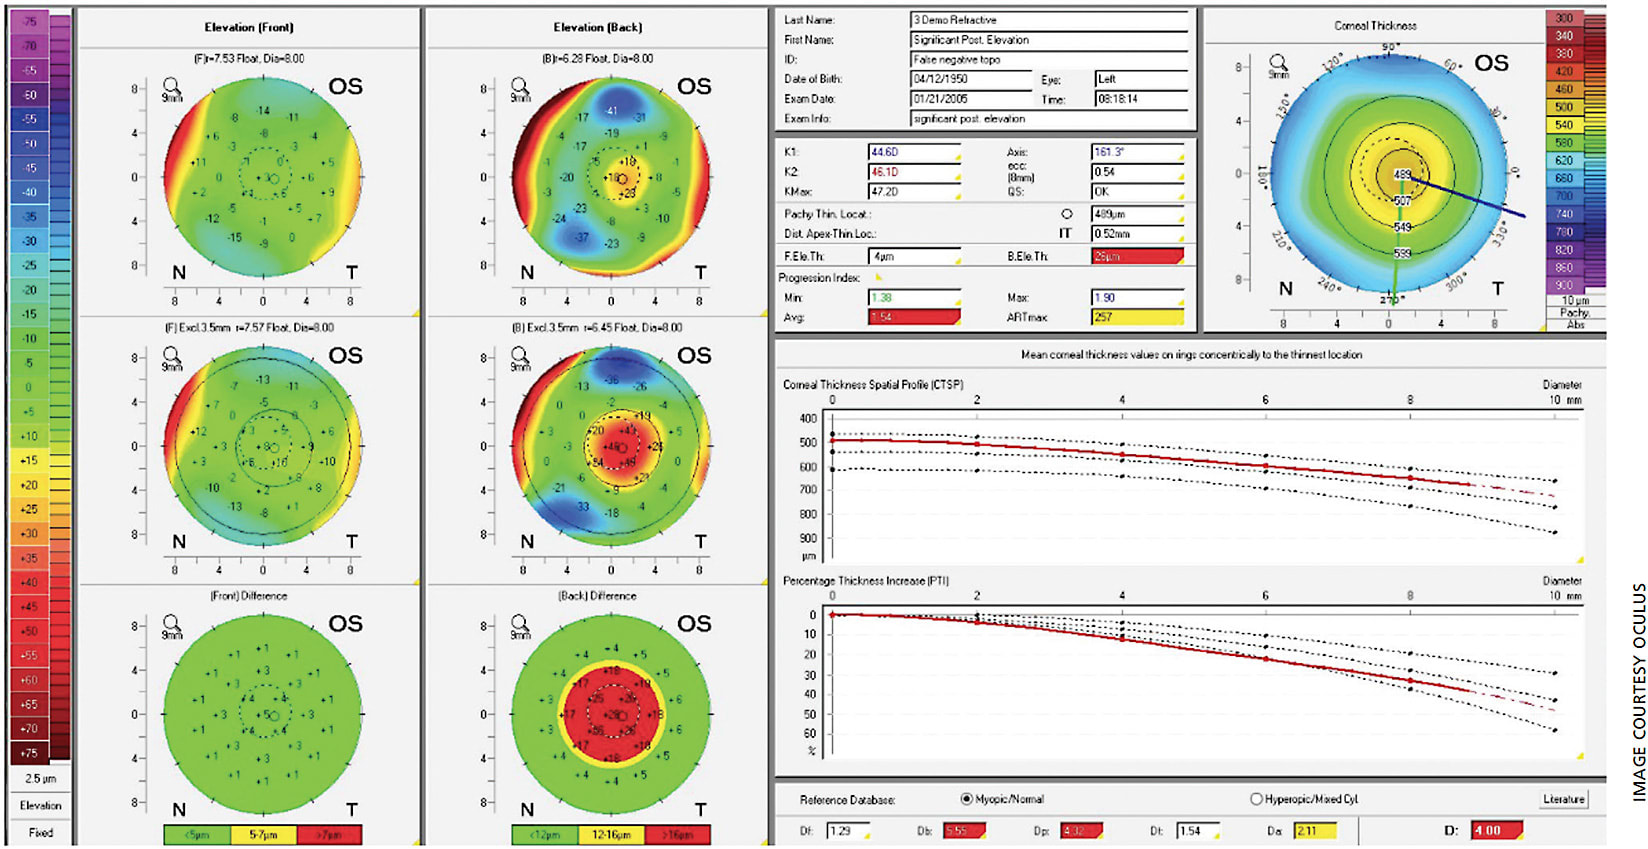
Anterior float and posterior float images, which are elevation maps, are generated on the Pentacam report as well. Instead of displaying the refractive power of the cornea, elevation maps display the shape of the cornea by comparing it to a computer-generated best-fit sphere (ie, a perfect sphere that best approximates the corneal shape on average). Posterior float, similar to the anterior float, shows the shape of the posterior cornea compared to a best-fit sphere.
The Belin-Ambrosio Enhanced Ectasia Display (BAD) combines elevation-based and pachymetric evaluation in one comprehensive display to give a global view of the tomographic image of the cornea. It provides a value that can determine the risk of corneal ectasia depending on the value of the reading.
The percentage increase in corneal thickness away from the thinnest point of the cornea positively correlates with subclinical and clinical keratoconus, which is displayed in the corneal thickness spatial profiling and percentage thickness increase chart.2,3 In the BAD, this is shown at the bottom right (Figure 1), displaying the D (standard deviations from mean) values of five parameters (change in anterior elevation, change in posterior elevation, corneal thickness at the thinnest point, thinnest point displacement and pachymetric progression). The final D value (most bottom right value) shows an overall value incorporating the previously mentioned five parameters. Any value from 1.6 SD to 2.6 SD is borderline, and any value above 2.6 SD is abnormal.1,4 In Figure 1, this value is 4.00 D, which supports the diagnosis of subclinical keratoconus and is therefore highlighted in red in the display.

Hashemi H et al conducted a study in 2016 that found that BAD_D, Index of Vertical Asymmetry, Index of Surface Variance and fifth order coma aberration of the front surface were the best parameters to diagnosis subclinical keratoconus. When combining all four variables, the sensitivity, specificity and area under the curve were 83.6%, 96.9% and 0.96, respectively.5
Similar to other devices, grading systems have been created for better assessment of keratoconus. The ABCD score (anterior radius of curvature, posterior [“back”] radius of curvature, corneal thickness at thinnest point and distance best corrected vision) was created to simplify and characterize different severities of keratoconus based on the score.6 Even though the Pentacam has an ABCD score display, there has been no evaluation of the score in regards to diagnosing subclinical keratoconus.
GALILEI
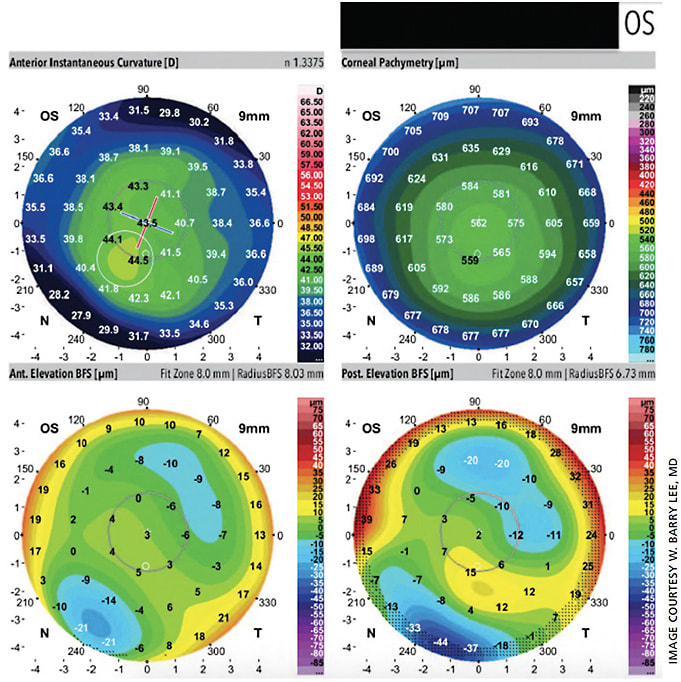
The Galilei dual Scheimpflug system provides traditional Placido-based imaging along with pachymetry, net corneal power, anterior-chamber depth, a corneal aberration map and elevation maps. It also provides a specialized keratoconus report that is helpful for screening and monitoring keratoconus (Figure 2). Most notably, these include keratoconus probability index (KPI), inferior-superior index (I-S), irregular astigmatism index (IAI) and differential sector index (DSI).4 Cutoff thresholds have been studied for each of these metrics for the diagnosis of clinical keratoconus as well as subclinical keratoconus.4 Values of the KPI of 10% or less, I-S ratio of 1.6 or less, IAI of 0.45 or less and DSI of 1.72 or less are generally accepted as cutoff values for subclinical keratoconus.4 The higher each value and the more values that are elevated simultaneously, the higher index of suspicion that keratoconus or corneal ectasia is present. Therefore, clinicians can say with a large degree of certainty that a patient has subclinical keratoconus, clinical keratoconus or no keratoconus at all.

Feizi S et al conducted a study in 2016 assessing the Galilei’s predictive ability of differentiating subclinical and clinical keratoconus from normal eyes.4 All 24 studied variables were strong enough (area under curve >0.80) to differentiate clinical keratoconus from normal eyes, with only four variables strong enough to distinguish subclinical keratoconus from normal eyes. These variables were the radii of both the anterior and posterior best-fit sphere, flat keratometry and mean keratometry. The KPI, I-S ratio, IAI and DSI were only strong enough statistically to differentiate clinical keratoconus from normal corneas and not from subclinical keratoconus. The radius of the posterior best-fit sphere cut-off of 6.27 had a sensitivity and specificity of 87% and the highest area under the curve. The most sensitive parameter (sensitivity of 91.3%) was the maximum posterior elevation of 12.5 um in a 5-mm zone.4
Our case, seen in Figure 2, had a maximum posterior elevation of 15 um in the left eye. No single set of indices (elevation, surface, pachymetric and keratometric indices) could completely detect subclinical keratoconus. Combining three of the sets (elevation, surface and keratometric data) showed a sensitivity of 97.7% and specificity of 84.6% with an area under the curve of 0.952.4 This combination was stronger than any of the other combinations studied.
Values such as the KP and KPI are stronger at detecting clinical keratoconus than subclinical keratoconus. Both of these values had higher specificity with poor sensitivity for subclinical keratoconus, which is not ideal for screening. A KPI above 5.0 and KP above 11.6 had sensitivities of 56.5% and 39.1% and specificities of 83.5% and 95.5%, respectively.4 Both of these cutoff values were met in our patient in Figure 2. No single variable from the Galilei was found to be very accurate in diagnosing subclinical keratoconus, and a combination of data points had the highest yield.
CONCLUSION
Corneal tomography is a useful tool for screening refractive surgery patients, cataract patients and corneal patients suspected of having keratoconus or ectasia. It is also valuable for management of astigmatism, collagen crosslinking and keratoplasty to both follow patients and decide on treatment success or failure. Scheimpflug imaging of the anterior and posterior corneal surfaces provides extremely valuable information for all these clinical scenarios. Moreover, modern tomography systems provide sophisticated metrics that can provide additional certainty to diagnosing keratoconus, subclinical keratoconus and post-LASIK ectasia.
As technology in the field of corneal and refractive surgery and the anterior segment continues to evolve, ophthalmologists will be able to more expediently and precisely diagnose and treat a variety of ocular conditions. OM
References
- Wilson SE, Klyce SD, Husseini ZM. Standardized color-coded maps for corneal topography. Ophthalmology. 1993;100:1723-1727.
- Belin MW, Khachikian SS, Ambrosio R, Salomao M. Keratonocus/Ectasia Detection with the Oculus Pentacam: Belin/Ambrosio Enhanced Ectasia Display. Highlights of Ophthalmology. Volume 35: 5-12. Retrieved from https://www.oculus.de/uploads/media/belin.pdf . Accessed August 13, 2020.
- Ambrosio R, Alonso RS, Luz A, Coca Velarde LF. Corneal-thickness spatial profile and corneal-volume distribution: tomographic indicies to detect keratoconus. J Cataract Refract Surg. 2006;32:1851-1859.
- Feizi S, Yaseri M, Kheiri B. Predictive Ability of Galilei to Distinguish Subclinical Keratoconus and Keratoconus from Normal Corneas. J Ophthalmic Vis Res. 2016;11:8-16.
- Hashemi H, Beiranvand A, Yekta A, et al. Pentacam top indices for diagnosing sublclinical and definite keratoconus. J Curr Ophthalmol. 2016;28:21-26.
- Belin MW, Duncan JK. Keratoconus: The ABCD Grading System. Klin Monbl Augenheilkd. 2016;233:701-707.


