Using technology to find, and fight, DR
UWF imaging, Doppler OCTs and more are finding the telltale signs of diabetic retinopathy.
By SriniVas R. Sadda, MD
Diabetic retinopathy (DR) remains the leading cause of blindness among working-age individuals in most nations, including the United States.1 Because it affects younger, working individuals, its toll on patients, their families and their country’s economy can be particularly devastating, as compared to older-age onset diseases such as age-related macular degeneration. What makes DR so hard to displace from its first-place spot is its connection with diabetes. That disease’s epidemic growth is a result of increasing obesity and decreasing physical activity levels.2
Landmark clinical trials have provided considerable information on the pathogenesis and course of DR. The Diabetes Control and Complications Trials (DCCT) and the United Kingdom Prospective Diabetes Study (UKPDS) have demonstrated that intensive control of blood glucose can reduce the rate of development and progression of DR in those with Type 1 and 2 diabetes.3,4 The UKPDS also established the importance of blood pressure control. Other epidemiological studies, such as the Wisconsin Epidemiological Survey of Diabetic Retinopathy (WESDR), have established the importance of duration of diabetes, smoking, serum lipids and associated nephropathy in the development of this retinal disease.5
With this information in mind, this article will discuss state-of-the-art imaging for patients with DR.
DR and its management
Patients lose vision from diabetes through three major mechanisms:
1. Complications of new vessel proliferation — vitreous hemorrhage and/or traction retinal detachment
2. Macular edema
3. Macular ischemia
While proliferative complications may lead to more severe and permanent vision loss, macular edema is the most common cause of decreased vision. Macular ischemia is less common as the single explanation for decreased vision and has no effective treatment.
Scatter panretinal photocoagulation was proven to be effective to reduce vision loss from proliferative diabetic retinopathy (PDR) in the Diabetic Retinopathy Study (DRS), and focal laser treatment was proven to be effective for diabetic macular edema in the Early Treatment of Diabetic Retinopathy Study (ETDRS).6,7
More recently, focal laser treatment has been supplanted by intravitreal pharmacotherapy (ranibizumab: Lucentis, Genentech; aflibercept: Eylea; Regeneron; dexamethasone implant: Ozurdex; Allergan; fluocinolone implant: Iluvien; Alimera Sciences), as the preferred and more efficacious treatment for diabetic macular edema.
History of imaging for DR
While measures of visual function were typically the most important outcome variables in the early therapeutic trials, imaging studies provided important corroborative data. A major imaging-based assessment in those trials was the determination of the overall level of DR severity within the eye. Many studies demonstrated that assessment of severity level from inspection of static color fundus photographs by trained expert graders was superior and more reliable than the typical clinician’s ophthalmoscopic/biomicroscopic exam.8 Color fundus imaging, however, was limited by the field of view or area of the retina that could be imaged — even with the use of steered photos to capture multiple overlapping fields (for example, ETDRS 7-field protocol).
Also, early color imaging was film-based, which limited analysis of these images to qualitative or semi-quantitative assessments.9 For example, assessment of DR severity was based on estimation of the numbers of various lesions relative to standardized reference photographs.10
Fluorescein angiography (FA) was also an important tool used in the assessment of DR in early clinical trials.11 FA identified the presence of macular ischemia that could compromise visual outcomes, subtle neovascularization, which was difficult to discern by color imaging, and specific leaking lesions (microaneurysms and telangiectatic capillaries) to be targeted by laser therapy. FA, like color photography, was limited by the field of view, which restricted most assessments to the posterior pole.
NEW INNOVATIONS IN IMAGING OF DR
Ultrawidefield angiography
Given that vascular lesions associated with DR can be seen well beyond the posterior pole, there is tremendous interest in evaluating the peripheral retinal vasculature. Early ultrawidefield devices had limited resolution or required contact with the eye, which limited their adoption. The real breakthrough for widespread use of ultrawidefield (UWF) imaging has been the introduction of non-contact widefield imaging devices, most notably the Optos platform and the wide-angle lens for the Heidelberg Spectralis system. The Optos system, however, has been shown to cover a wider area of the retina, and therefore is used more for the evaluation of the peripheral retina in DR.12
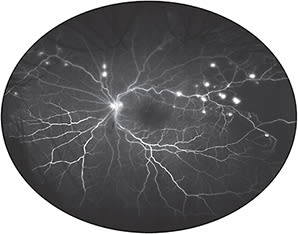
Kiss and colleagues have shown that UWF FA can frequently reveal extensive nonperfusion and neovascularization missed by standard 7-field ETDRS (Figure 1).13 This suggests that conventional imaging can lead to an understaging of DR.14 Because peripheral nonperfusion can now be identified with precision, several investigators have suggested that scatter laser could be targeted specifically to areas of nonperfusion rather than being applied indiscriminately to the entire peripheral retina — thereby potentially limiting damage to “seeing” retina and reducing the side effects of the procedure.15 The efficacy of targeted retinal photocoagulation (TRP), however, still has to be firmly established in prospective trials.16

Figure 1. Optos ultrawidefield fluorescein angiogram of the left eye of a patient with proliferative diabetic retinopathy. Numerous small areas of neovascularization and extensive peripheral non-perfusion, not evident by ophthalmoscopy, are clearly evident by ultrawidefield imaging.
COURTESY SRINIVAS R. SADDA, MD
UWF color imaging
Optomap pseudo-color images have red and green SLO reflectance images, and thus should not be considered the same as flash white-light fundus images. Despite this difference, Kernt and colleagues have shown that DR lesions can be identified similarly on these pseudo-color images.17 Also, Silva and colleagues have shown that many diabetic patients show a discordance between the severity of diabetic lesions in the periphery compared to the posterior pole/7-standard fields, and that consideration of only the 7-standard fields often resulted in an underestimation of disease severity.18 In addition, eyes with predominantly peripheral lesions tended to progress faster than patients with predominantly central lesions, further emphasizing the critical importance of assessing the retinal periphery in diabetics.
These observations are now being evaluated in larger prospective studies. Another major benefit of Optomap imaging of DR, particularly for telescreening programs, is a much lower rate of ungradable images with nonmydriatic imaging.
Doppler OCT
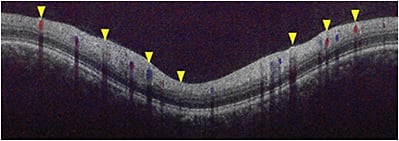
The Doppler phase shift information is available in OCT B-scan images, but has not been used by most devices. A major challenge has been the translation of the phase shift information into an actual velocity or flow value within the vessel. To convert the magnitude of the phase shift into a velocity, it is critical to know the angle at which the imaging light strikes the vessel. To establish the vessel’s position, Huang and colleagues developed a circumpapillary double circular scan acquisition protocol that transected every artery and vein entering and exiting the optic nerve head in two locations.19 By knowing the vessel position in two scans, the trajectory of the vessel and the angle relative to the light beam could be computed (Figure 2). In addition, because every vein exiting the retina is transected, this scan protocol allows the total retina blood flow of the eye to be computed.

Figure 2. Circumpapillary Doppler OCT B-scan. Flow in the retinal blood vessels revealed by the Doppler shift is color-coded red or blue based on the direction of flow relative to the incident imaging light beam.
COURTESY SRINIVAS R. SADDA, MD
Using this Doppler OCT technique, Lee and colleagues demonstrated that retinal blood flows are decreased in eyes with more severe retinopathy, but that the flow remains relatively unchanged following PRP treatment.20 Laser Doppler Flowmetry and the Retinal Function Imager, and the Doppler OCT, are all used for retinal blood flow measurement.
OCT angiography
Despite the wealth of information provided by FA (centrally or by UWF imaging), the technology does require intravenous administration of dye, which could be associated with serious systemic complications, albeit rare. Recently, advances in OCT acquisition protocols and imaging processing techniques have allowed moving structures in the eye to be selectively isolated. By eliminating bulk eye movement (i.e., fixation artifact) through tracking or post-processing, what is left is eye motion largely limited to flow in blood vessels. To achieve this motion contrast, research groups have used phase/Doppler shift approaches (“phase contrast” OCT), magnitude-based techniques (e.g., split-spectrum amplitude decorrelation angiography or SSADA), or a combination of both methods (OCT microangiography or OMAG). OCT angiography provides unprecedented detail of the retinal capillary microcirculation, but perhaps even more important, allows the circulation to be separately evaluated at various depths.
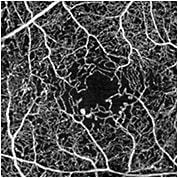
Although OCT angiography is still a technique early in development and not yet FDA cleared, its potential value as a tool to evaluate DR is enormous — particularly for the assessment of capillary nonperfusion (Figure 3) at various levels, including selective deep capillary plexus ischemia. Future inclusion of OCT angiography in prospective clinical trials will allow the role of this promising imaging technology to be better defined.

Figure 3. En face OCT angiographic (OCTA) image in the eye of a patient with diabetic retinopathy. OCTA reveals enlargement of the foveal avascular zone with parafoveal capillary loss and several large microaneurysms. (Prototype swept source OCT from Carl Zeiss Meditec, not FDA cleared).
COURTESY SRINIVAS R. SADDA, MD
Retinal oximetry and hyperspectral imaging
Retinal oximetry techniques image the retina with multiple separate wavelengths (hyperspectral imaging). Differences in the absorption characteristics of oxygenated and deoxygenated hemoglobin at different wavelengths is utilized for determination of the oxygenation level of blood within vessels. Specifically, the retinal veins and arteries manifest a difference in reflectance at different wavelengths — based on these differences, the oxygen saturation may be determined.
Summary
Advances in imaging technologies have allowed DR to be studied with unprecedented detail and precision. New discoveries from UWF imaging, OCT angiography, and Doppler OCT have given new insights into disease pathophysiology and response to therapy. Inclusion of these technologies into prospective clinical trials should facilitate optimal use of these technologies in clinical practice. OM
REFERENCES
1. Muni RH, Kohly RP, Lee EQ, et al. Prospective study of inflammatory biomarkers and risk of diabetic retinopathy in the diabetes control and complications trial. JAMA Ophthalmol. 2013;131:514-521.
2. Centers for Disease Control and Prevention. National Diabetes Statistics Report. New cases of diagnosed diabetes. http://www.cdc.gov/diabetes/pubs/statsreport14/national-diabetes-report-web.pdf. Accessed June 11.
3. Cleary PA, et al. Diabetes Control and Complications Trial. https://clinicaltrials.gov/ct2/show/NCT00360815. Accessed June 11.
4. United Kingdom Prospective Diabetes Study. BMJ. 1995:310-383.
5. Klein BE, Klein R, Moss SE. Self-rated health and diabetes of long duration. The Wisconsin Epidemiologic Study of Diabetic Retinopathy. Diabetes Care. 1998;2:236-240.
6. Diabetic retinopathy study. Report Number 6. Design, methods, and baseline results. Report Number 7. A modification of the Airlie House classification of diabetic retinopathy. Prepared by Diabetic Retinopathy. Invest Ophthalmol Vis Sci. 1981;21(1 Pt 2):1-226.
7. Four risk factors for severe visual loss in diabetic retinopathy. The third report from the Diabetic Retinopathy Study. Diabetic Retinopathy Study Research Group. Arch Ophthalmol. 1979;97:654-655.
8. Moss SE, Klein R, Kessler SD, Richie KA. Comparison between ophthalmoscopy and fundus photography in determining severity of diabetic retinopathy. Ophthalmol.1985;92:62-67.
9. Milton RC, Ganley JP, Lynk RH. Variability in grading diabetic retinopathy from stereo fundus photographs: comparison of physician and lay readers. Br J Ophthalmol. 1977;61:192-201.
10. Klein R, Klein BE, Magli YL, et al. An alternative method of grading diabetic retinopathy. Ophthalmol. 1986;93:1183-1187.
11. Khalaf SS, Al-Bdour MD, Al-Till MI. Clinical biomicroscopy versus fluorescein angiography: effectiveness and sensitivity in detecting diabetic retinopathy. Eur J Ophthalmol. 2007;17:84-88.
12. Witmer MT, Parlitsis G, Patel S, Kiss S. Comparison of ultra-widefield fluorescein angiography with the Heidelberg Spectralis noncontact ultra-widefield module versus the Optos Optomap. Clin Ophthalmol. 2013;7:389-394.
13. Wessel MM, Nair N, Aaker GD, et al. Peripheral retinal ischaemia, as evaluated by ultra-widefield fluorescein angiography, is associated with diabetic macular oedema. J Ophthalmol. 2012;96:694-698.
14. Wessel MM, Aaker GD, Parlitsis G, et al. Ultra-wide-field angiography improves the detection and classification of diabetic retinopathy. Retina. 2012. 32:785-791.
15. Reddy S, Hu A, Schwartz SD. Ultra Wide Field Fluorescein Angiography Guided Targeted Retinal Photocoagulation (TRP). Semin Ophthalmol. 2009;24:9-14.
16. Muqit MM, Young LB, McKenzie R, et al. Pilot randomised clinical trial of Pascal TargETEd Retinal versus variable fluence PANretinal 20 ms laser in diabetic retinopathy: PETER PAN study. Br J Ophthalmol. 2013;97:220-227.
17. Kernt M, Hadi I, Pinter F, et al. Assessment of diabetic retinopathy using nonmydriatic ultra-widefield scanning laser ophthalmoscopy (Optomap) compared with ETDRS 7-field stereo photography. Diabetes Care. 2012;35:2459-2463.
18. Silva PS, Cavallerano JD, Sun JK, et al. Peripheral lesions identified by mydriatic ultrawide field imaging: distribution and potential impact on diabetic retinopathy severity. Ophthalmol. 2013;120:2587-2595.
19. Tan O, Wang Y, Konduru RK, et al. Doppler optical coherence tomography of retinal circulation. J Vis Exp. 2012. Sep 18:e3524. doi: 10.3791/3524.
20. Lee JC, Wong BJ, Tan O, et al. Pilot study of Doppler optical coherence tomography of retinal blood flow following laser photocoagulation in poorly controlled diabetic patients. Invest Ophthalmol Vis Sci. 2013;54:6104-6111.
About the Author | |

| SriniVas R. Sadda, MD, is president and chief scientific officer, Doheny Eye Institute, Stephen J. Ryan - Arnold and Mabel Beckman Endowed Chair and professor of Ophthalmology University of California – Los Angeles (UCLA) Geffen School of Medicine and the medical director of the Doheny Image Reading Center at the Doheny Eye Institute. |


