Understanding the Utility of Spectral Domain OCT in Glaucoma
Here's how top physicians use Cirrus HD-OCT to diagnose and treat patients.
By Erin Murphy, Contributing Editor
Spectral domain optical coherence tomography (SD-OCT) has proven to be a very useful tool for the detection and management of glaucoma. Its 3-D imaging enhances reproducibility and registration and offers the objective quantitative data that supports global standardization of care at an expert level. SD-OCT helps physicians establish and pinpoint correlations in ocular structure and function, matching areas of abnormal tissue with attendant vision problems. The technology also may enhance sensitivity and specificity in disease detection and reduce uncertainty in glaucoma suspects. Software is under development to help detect disease progression.
SD-OCT is part of the standard approach of many physicians to managing glaucoma.
Reproducibility Study
Kim and colleagues1 studied the reproducibility of time domain OCT and Cirrus HD-OCT. It's been well documented that HD-OCT produces high-definition digital photos. Physicians can see cross-sectional images and 3-D cubes and can detect fluid or topographic distortion, making it easy to see the presence of pathology. High precision digital imaging has become an excellent advantage of OCT that ophthalmologists have relied on for years.
However, one of the great features of OCT is its objective quantitative data, which is what will drive this technology in the global standardization of care, according to Joel S. Schuman, MD, FACS, professor and chairman of ophthalmology at the Eye and Ear Foundation, University of Pittsburgh School of Medicine, and director of the University of Pittsburgh Medical Center (UPMC) Eye Center. Physicians can expect the same good quantitative, reproducible data in Omaha, Beijing and Madrid.
To ensure that reproducibility is excellent, Kim and colleagues1 studied the reproducibility of time domain OCT versus Cirrus HD-OCT.
Hypotheses. Researchers approached the study1 with two hypotheses: First, they believed Cirrus HD-OCT would have better reproducibility than time domain OCT. Second, they knew that when they took retinal nerve fiber layer (RNFL) measurements, they should measure a 3.4-mm scanning circle, centered on the optic nerve head. They believed the placement of that circle would influence the value and, therefore, the reproducibility. In other words, the way they placed the circle would be relevant. And there are two ways to place the circle. Physicians can center a new circle every time they have a data cube or do what some of the confocal scanning laser ophthalmoscopes do and register the images. Then they can import the circle they placed the first time.
Methods. The researchers enrolled 14 healthy subjects and studied 27 eyes. Using time domain OCT (Stratus OCT software version 5.0) and HD-OCT (Cirrus HD-OCT software version 3.0), they performed three repeated scans per eye on the same day. With time domain OCT, they performed a fast RNFL scan with a signal strength ≥ 6. They performed an optic disc cube scan with Cirrus HD-OCT at a signal strength ≥ 8.
Results. The study validated the researchers' first hypothesis. With statistical significance, Cirrus HD-OCT showed better RNFL thickness measurement reproducibility than time domain OCT.
They invalidated the second hypothesis. Resampling circle location variation on Cirrus HD-OCT was relatively small from scan to scan, and there was no statistically significant difference between the "center each time" and "center once" methods. No matter which method the researchers used, the device found the center of the optic nerve, recognized a 3.4-mm circle centered on that point and measured the RNFL thickness along the circle. The data showed the reproducibility was very high for both time domain and HD-OCT. When they looked at the interclass correlation coefficient, the standard deviation for the overall thickness was about 2.5 microns with time domain and about 1 micron for HD-OCT.
Glaucoma-specific Benefits of SD-OCT
In addition to its high reproducibility, SD-OCT technology can have a high utility for glaucoma suspects by helping physicians achieve these key goals:
• Identify areas of abnormality
• Reduce uncertainty in patients they'd normally classify as glaucoma suspects
• Get all the benefits of 3-D imaging. This means achieving more reproducible measurements, exact correspondence with the fundus image and the promise of greater sensitivity to abnormality and change over time.
• Use statistical software for the measurement of progression. This software is still in development, although it should be available soon.
• Correlate structure and function to diagnose glaucoma and track its progression. Physicians need detailed information about the structure-function relationship between SD-OCT, RNFL thickness and function shown through perimetry testing. Using SD-OCT technology, ophthalmologists can see a strong relationship between structure and function, and that's very important for gauging the status of a glaucoma patient, Dr. Schuman says.
Clinically, some physicians frequently use SD-OCT to achieve these goals. The following cases are examples of how they use the technology.
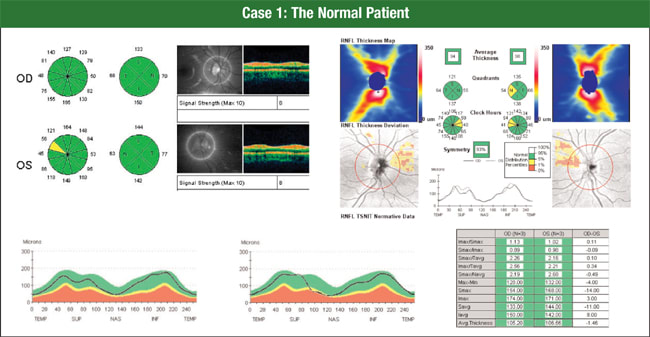
Case 1: The Normal Patient
In a normal patient, physicians clearly can identify the differences between time domain and SD-OCT (Figure 1), Dr. Schuman says. Both devices provide tomograms and RNFL profiles. In this patient, you can see that the same nasal spot at one clock hour is borderline thin.

Figure 1. Time domain OCT and spectral domain OCT both provide tomograms and RNFL profiles. Here, the additional information provided by the 6-mm × 6-mm cube of data from Cirrus HD-OCT (upper right) shows a normal-looking RNFL distribution, despite a few areas nasally outside the normal range.
When you look at Cirrus HD-OCT, an SD-OCT device, you can see a normal-looking RNFL thickness distribution, despite a few areas nasally outside the normal range, Dr. Schuman says. Physicians see this occur occasionally, and the nasal area is the most variable by OCT RNFL analysis.
The new glaucoma progression analysis software that soon will be available for Cirrus HD-OCT displays a series of scans and calculations of mean thickness to help detect changes in RNFL thickness over time.
Case 2: Structure and Function
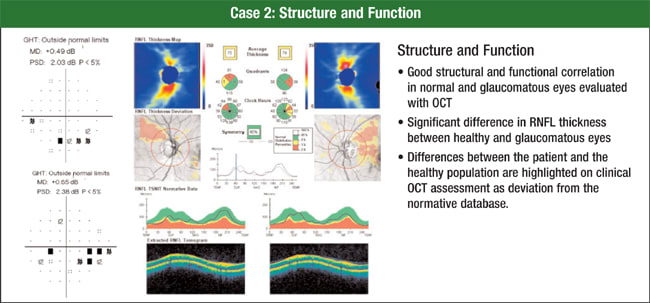
SD-OCT demonstrates good structural and functional correlation in both normal and glaucomatous eyes, Dr. Schuman says. Often, physicians find a significant difference in RNFL thickness between healthy and glaucomatous eyes — a difference established by the software's comparison of patient data against a normative database.
An OCT assessment of a patient's RNFL thickness is particularly helpful in glaucoma suspects, Dr. Schuman says. If patients have a suspicious-looking optic nerve head, a family history of glaucoma, normal visual fields, and an IOP in the normal or borderline range, OCT RNFL measurements can offer an independent predictor of the glaucomatous change.1
For the most accurate results, ophthalmologists look at not only mean deviation on the visual field, but also a newer parameter called the visual field index that better compensates for nonglaucomatous visual field loss, Dr. Schuman says.
When a physician examined the visual field and pattern deviation of the patient in this example, he found an inferior arcuate scotoma in each eye and a slightly deeper nasal step in the right eye (Figure 2). Instead of doing a circular scan centered on the nerve, he acquired a 200 × 200 data cube. The software extracts the circular scan, or circumpapillary information, from that data cube, giving physicians high reproducibility and good registration from scan to scan, Dr. Schuman says.

Figure 2. Visual field and pattern deviation analysis show this patient has an inferior arcuate scotoma in each eye and a slightly deeper nasal step in the right eye. This correlates well with Cirrus RNFL analysis.
The Cirrus HD-OCT printout also enables ophthalmologists to see an RNFL thickness map, a deviation plot, the RNFL thickness profile and have the profile overlaid on normative data.
Printouts include the mean thickness in quadrants and clock hours. Physicians clearly can see that the RNFL is thinner on the top half than on the bottom half, Dr. Schuman says. The numbers showed an RNFL thickness that was statistically significantly reduced compared to a healthy eye of a person in the patient's age group, and the RNFL thickness profile illustrated where the thickness dropped down into the abnormal range.
Case 3: Following Glaucoma Suspects
Physicians are always looking for signs in patients who are glaucoma suspects, Dr. Schuman says. Does the patient need treatment, or can a doctor follow him without treatment?
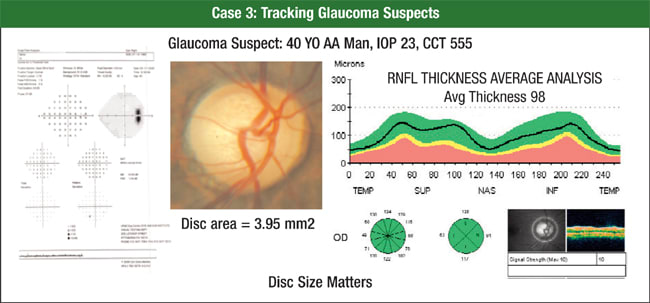
A 40-year-old African American man presented with an IOP of 23 mmHg, a central corneal thickness of 555 microns and a normal visual field (Figure 3). A physician determined he had a large cup because he had a large disc. OCT put his RNFL thickness well within the normal range, so the physician decided to monitor him.

Figure 3. A 40-year-old African American man presented with an IOP of 23 mmHg, a central corneal thickness of 555 microns and a normal visual field. His physician determined he had a large cup because he had a large disc. OCT put his RNFL thickness in the normal range, so he decided to monitor him.
Ophthalmologists can follow RNFL thickness for change over time to track glaucoma progression, but validated, robust software for this purpose is still in development. When it's introduced, physicians may have the ability to detect progression more accurately using the SD-OCT RNFL thickness measurement rather than using the visual field and perimetry, Dr. Schuman says. OCT detection of a thin RNFL is an independent predictor of future glaucomatous change.2
Case 4: Patient with Glaucoma
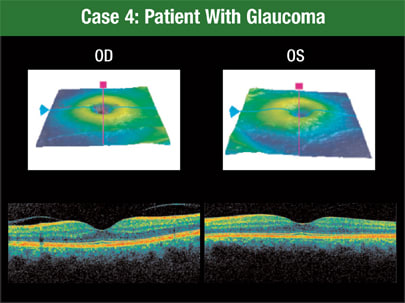
Of course, the most important goals for glaucoma patients are obtaining a specific diagnosis to guide treatment, following the effects of treatment and detecting any disease progression, Dr. Schuman says. In this case, the patient has an RNFL defect inferotemporally in the left eye (Figure 4).

Figure 4. The macular segmentation feature of Cirrus HD-OCT shows a patient with an RNFL defect inferotemporally in the left eye.
Macular segmentation with Cirrus HD-OCT shows even more information about the area of damage. Using this function, physicians can see the patient's focal defect extending into the macula, layer by layer, Dr. Schuman says.
What's more, although Cirrus HD-OCT was able to detect an abnormality in this patient, it wasn't perceptible with time domain OCT. The RNFL doesn't fall outside the normal range until it gets beyond the area of that 3.4 mm diameter circle.
Advantages of OCT
OCT helps physicians establish the presence or absence of glaucoma. They can use OCT in the correlation of structure and function, identify abnormalities and achieve truly sensitive screening for the disease. Today, ophthalmologists are realizing the power of HD-OCT. They're developing strategies to use the vast amounts of data it collects to improve patient care. And they're constantly extending the possibilities as new software emerges. OM
| References |
|---|
|


