OCT Terminology – Demystified!
A pioneer of the technology provides a translation of the latest jargon.
BY DAVID HUANG, M.D., PH.D
Optical coherence tomography terminology is confusing, and I am partly to blame for it. The term OCT came from our 1991 article in Science that first described this new technology,1 and my Ph.D. thesis at MIT of the same title under the supervision of Professor James Fujimoto. We combined components of the pre-existing terms "optical coherence domain reflectometry" and "computed tomography" to come up with the term OCT. Unfortunately, the new term made so little sense to the non-engineer that it is sometimes called "ocular computed tomography" or "ocular coherence tomography."2
So what does "optical coherence tomography" mean? Well, "optical" refers to the fact that a beam of light (typically in the near-infrared spectrum) is used to scan the sample of interest. In classic OCT, reflections from various layers of the sample are detected one depth at a time, by scanning the position of a reference mirror (Figure 1). When the time-of-flight delay of the reference mirror matches the sample reflection of a certain depth, they interfere coherently and produce a signal that could be detected. Thus, the word "coherence" was introduced. Tomography means cross-sectional imaging. It was part of the name because X-ray computed tomography (CT) was sexier than ultrasound imaging in 1991. So I preferred to refer to each cross-sectional image as a tomogram or section. However, people in ophthalmology are more familiar with ultrasound than CT, so now ultrasound terms such as "B-scan" and "C-scan" are more in vogue in OCT literature. More on these terms later.
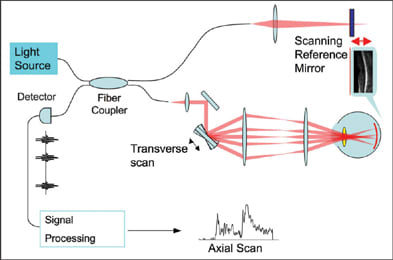
Figure 1. Schematics of time-domain OCT. The reference mirror (upper right) moves back and forth over a distance that corresponds to the axial (depth) range of interest in the sample. The data acquisition is synchronized with the scan cycle of the reference mirror. Each cycle provides one axial scan that contains information on the reflected signal strength versus depth in the sample. A transverse scan mirror steers the probe beam over a transverse dimension. The OCT image is a representation of reflected signal strength over axial and transverse dimensions.
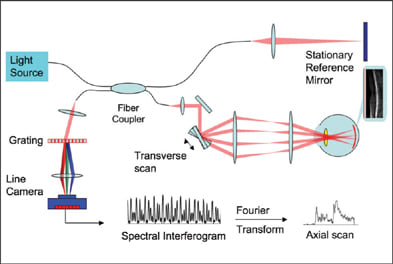
Figure 2. Schematics of a spectrometer-based Fourier-domain OCT system. The reference mirror is stationary. The spectral interferogram is the spectrum of the combined reference and sample reflections. Reflections from different depths of the sample produce spectral modulations of different periodicities. The Fourier Transform converts the spectral modulations into depth information (axial scan).
Besides the technical terms, there are even more terms introduced for marketing purposes. Topcon uses the name "3D OCT" to emphasize the fact that FD-OCT is able to acquire a 3D data within a few seconds. The 3D data can then be viewed by oblique cut-away (Figure 3), scrollthrough or fly-through of successive sections, en face project and C-scan. All FD-OCT systems on the market offer raster scan acquisition of 3D data and 3D viewing software. Zeiss calls the Cirrus system "HD-OCT" to emphasize the high-definition aspect of FD-OCT. With speeds ranging from 17,000 to 40,000 axial scans per second, the current generation of FD-OCT retinal scanners can all acquire a 1,000-line high-definition OCT image in a largely motion-free time frame (25 to 59 milliseconds). So the distinction is more in marketing emphasis than performance.
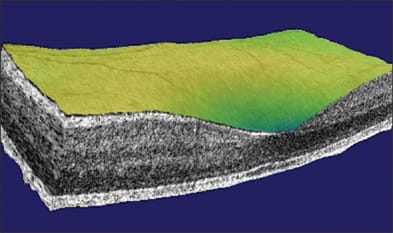
Figure 3. Cut-away 3D view of the macula taken with the Optovue RTVue system.
Don't pay too much attention to marketing terms. Try each OCT system that you consider buying. See how quick it is to acquire a scan, how easy it is to scroll through 3D image sets, look at the contrast between retinal layers on the high-definition images and assess the various maps and parameters that can help you make clinical decisions.
Ultrahigh resolution (UHR) OCT captures images with the highest possible depth resolution. The depth resolution of OCT depends on the coherence length, which is inversely proportional to the width of the spectrum in the OCT probe beam.
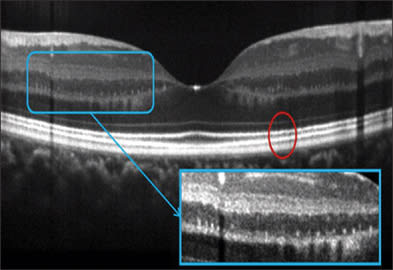
Figure 4. Three-micron resolution image of the normal retina taken with the Bioptigen 3D SDOCT with the high resolution option. Image courtesy of J. Carroll, Medical College of Wisconsin and Bioptigen, Inc.

Figure 5. The Heidelberg Spectralis uses eye tracking and frame-averaging to provide essentially speckle-free images that appears sharper than the nominally 8-micron resolution would seem to indicate. Image courtesy of Heidelberg Engineering GmbH.

Figure 6. Frame-averaged OCT image provide details of the outer retinal layers in this case of drusenoid pigment epithelial detachment (PED). Photoreceptor atrophy reduces the distance between the outer plexiform layer to the pigment epithelium from 122-150 microns to 59 micron over the PED, with loss of the bright lines at the external limiting membrane and photoreceptor inner-outer segment junction. Bruch's membrane could be visualized at the base of the PED. Frame averaging also boost the signal and helps one visualize the choroid-sclera junction. The Optovue RTVue FD-OCT system was used.
Optical coherence tomography is analogous to ultrasound imaging and radar in that they are all based on measuring the delay of a reflected radiation. So ultrasound terms such as A-scan, B-scan and C-scan have exact analogs in OCT. In ultrasound, A-scan refers to the oscilloscope display where the vertical dimension is used to display amplitude and the horizontal dimension represents the echo delay. In OCT, A-scan can also be taken as the abbreviation for axial scan, representing reflected optical amplitude along the axis of light propagation. Ultrasound B-scan referred to the cathode ray tube display where the brightness represents the amplitude of echoes. In OCT, a B-scan refers to the cross-sectional image where the amplitudes of reflections are represented in a gray scale or a false-color scale. In ultrasound, a C-scan refers to a section across structures at an equal echo delay (depth). In OCT, a C-scan refers to a section across structures at an equal optical delay. In the eye, the C-scan also conveniently corresponds to the coronal section. With FD-OCT, C-scans are synthesized from the 3D dataset. In retinal imaging, it is actually more useful to modify the C-scan to cut across a surface reference to the retinal pigment epithelial surface (Figure 7) or the inner retinal surface.
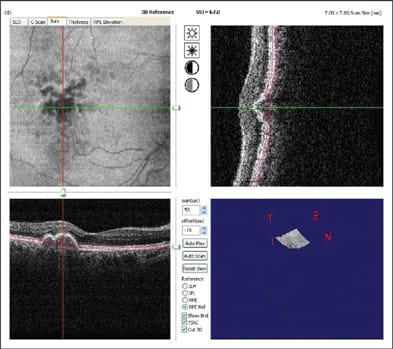
Figure 7. C-scan (upper-left) along the retinal pigment epithelium baseline (see upper-right and lower-left B-scans) helps one visualize the extent of drusenoid pigment epithelial detachment in an eye with age-related macular degeneration. The Optovue RTVue FD-OCT system was used.
I hope this review helps the reader navigate the jungle of terminology in the OCT literature and marketplace. Remember, if you use the wrong term, I will surely point it out in a letter to the editor.3 OM
References
- Huang D, Swanson EA, Lin CP, Schuman JS, Stinson WG, Chang W, Hee MR, Flotte T, Gregory K., Puliafito CA, Fujimoto JG. Optical coherence tomography. Science. 1991;254:1178-81.
- Tseng JJ, Turano MR, Jr., Langton K, Chang S. Measurement of retinal thickness by ocular coherence tomography in a case of scleral transparency in high myopia. Am J Ophthalmol. 2004;138:169-70.
- Huang D. "Optical" coherence tomography not "ocular" coherence tomography. J Cataract Refract Surg. 2007;33:1141.
| David Huang, M.D., Ph.D., is director of the Doheny Eye Institute Laser Vision Center and associate professor of ophthalmology at the University of Southern California, Los Angeles. He receives patent royalty from the Massachusetts Institute of Technology based on optical coherence tomography technology licensed to Carl Zeiss Meditec. Dr. Huang receives research grants, stock options, potential patent royalties and travel support from Optovue, Inc. |


