SPONSORED BY M&S TECHNOLOGIES
ADVANCING CONTRAST TESTING
Unique design, automation and accurate data analysis distinguish the Holladay Automated Contrast Sensitivity System.
By Jack T. Holladay, MD, MSEE, FACS
The spectrum of what we call vision, or visual performance, has two primary components: visual acuity and contrast sensitivity. Visual acuity testing measures the smallest high-contrast target that a person can see, such as the 20/20 line on a high-contrast chart. Contrast sensitivity testing measures the largest target that patients can see at low contrast, which might be comparable to a low-contrast letter at the 20/100 to 20/200 chart line.
In essence, rather than asking a visual acuity question such as, "Can you read the fine print on a bottle of aspirin?" contrast sensitivity asks the opposite question, such as, "Can you see a gray truck when you're driving in the fog?"
We have long viewed visual acuity as the single most important indicator of vision quality. However, we're coming to understand that quality real-world vision is actually a combination of visual acuity and contrast sensitivity. Some think that contrast sensitivity may be more important for patients' "getting-around vision" because low-contrast situations, such as facial recognition and distinguishing obstacles while walking, are more commonplace than high-contrast situations. This may explain why some patients express complaints despite having high visual acuity.
Now contrast sensitivity testing is taking its place alongside visual acuity in patients' regular testing, and the quality of the testing methods has improved immensely.
CURRENT TESTING
The most common contrast sensitivity tests use charts similar to the Snellen visual acuity chart. The Pelli-Robson shows patients rows of same-sized letters in descending contrast levels (gradually lighter shades of gray). The Bailey-Lovie chart, which can be a paper chart or a part of an autorefractor, shows letters of decreasing size in the same low-contrast gray. Other tests like the Campbell-Robson chart use sinusoidal grating (lines with edges that are blended, rather than distinct) with different spatial frequencies to measure contrast sensitivity.
Certain problems are inherent with a paper chart. First, the charts fade over time, making the results less accurate. The lighting environment also affects the results. The chart must be illuminated, but without calibrating the room, ambient light from windows and neighboring exam lanes can alter the results of the test.
| Benefits of the Holladay Automated Contrast Sensitivity System (HACSS) |
|---|

• Brightness: The LCD monitor with attached computer is calibrated to 85 and 3 Cd/m2. This is the controlled, optimal illumination. • New optotypes: The sinusoidal bullseye eliminates the inherent biases of previous systems, leveling the playing field for patients with all kinds of astigmatism and aberrations. • Blanking period: A 10-second blanking period allows the eye's receptors to refresh for a clean, accurate test. • Timed response: Patient response time isn't openended. They have 10 seconds to respond, so the test reflects their visual performance, rather than their ability to scrutinize the targets. • Reliability index: The system provides this number — 0 to 100% — based on how a patient's responses compare to a control. "Trigger-happy" (false positive) and "gunshy" (false negative) patients are detected. • Automation: A technician gives patients instructions the first time they take the test, and then the patients themselves control the test in 9 to 10 minutes. |

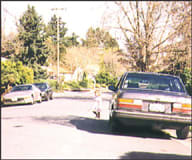
Figure 1. Because we don't live in a black-and-white world, contrast sensitivity, or our ability to resolve targets of similar value, is an essential measure of visual performance. |
Vertical sinusoidal grating charts also can be problematic. Coma or other higher-order aberrations affect the results. The charts are biased for with-the-rule astigmatism and horizontal coma. When patients view them vertically, people with the same refractive error and different axes of astigmatism don't see the lines equally.
As a result, astigmatic evaluation usually is tested by asking astigmatic patients to view a sunburst dial and asking them to note which part of the dial is clearest. The answers — horizontal, vertical or oblique — depend on a patient's angle of astigmatism. Once we find out which part of the dial looks darkest, we orient the test to match.
More than 20 years ago, physicians began doing sinusoidal grating tests on monitors, but it wasn't economical at the time to put a monitor in every room. We tried black-and-white, square-wave gratings, as well as black-and-white sinusoidal gratings that varied from bright to dark, and the latter worked best. We also tried different sized gratings, or different wavelengths, from 3 to or 30 cycles per degree.
These tests have been around for years, but we're always making prog ress on new designs. One study1 published in 2009 compared two new electronic tests, as well as five different contrast sensitivity charts. Researchers found the charts didn't reveal contrast sensitivity issues related to spherical aberration, but one of the electronic systems showed this relationship with an artificial pupil. This system is called the Holladay Automated Contrast Sensitivity System (HACSS).
Contrast Sensitivity System 
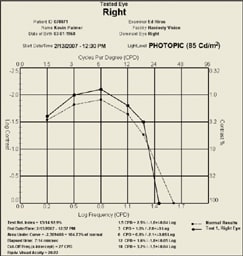
Figure 2. The printed report for the HACSS includes a graphic comparison to normative data. |
NEW DESIGN
I helped develop the HACSS with M&S Technologies, using the Sinusoidal Bull's Eye Target to eliminate the orientation of aberrations. The HACSS is integrated into the Smart System 2020 series Visual Acuity System (M&S Technologies, Inc.), a contrast sensitivity and video display system.
Rather than rely on horizontal charts and sunburst dials, we decided to use a sinusoidal bull's eye (rotationally symmetric targets and randomly presented optotypes). With this design, everyone is equal. The bull's eye optotype eliminates biases from the patient with nonrotational, symmetric optical aberrations, such as residual astigmatism, coma and trefoil. It eliminates other test biases for with-the-rule aberrations, such as vertical astigmatism and vertical coma, and against aberrations such as against-the-rule astigmatism and horizontal coma. In short, it tests contrast sensitivity independently of higher-order aberrations or varying axes of astigmatism.
Unlike older video tests, the HACSS is automated and uses a high-resolution LCD monitor. It puts all vision testing in one box. In addition, the system is programmable. You can set 6 cycles per degree if you like, or you can perform some tests, such as visual acuity or contrast sensitivity and not perform others. The system also stores patient data. So on subsequent visits, the system can evaluate current results with past results, then display comparative data and comparisons to a normative database for contrast sensitivity.
| Problems With Current Contrast Sensitivity Tests |
|---|
| • Lack of illumination control: Contrast sensitivity charts should be illuminated at 85 and 3 Cd/m2. However, the lighting is difficult to control because of windows and room lights. • Limits of vertical linear gratings: These tests are biased for with-the-rule astigmatism and horizontal coma. • No blanking period: Photoreceptors should be "rested" before each presentation, but there's no opportunity for this rest with typical contrast sensitivity tests. • Unlimited patient response time: To avoid the effects of focusing in the tests, patient response time shouldn't be open-ended. However, in most common tests, patients have no set time limit for their response. • False positives: Because some patients are "trigger happy" in their responses to sinusoidal gratings, they may create false positive test results |
The HACSS also has these key advantages:
• Patient-driven: The system is fully automated, and its user-interactive testing mechanism eliminates technician bias. After brief instruction, the technician can leave the room, and the system makes a sound indicating when the test is complete. During the test, the testing protocol blanks the screen for a predetermined period to allow the retina to completely refresh between displays. It also gives patients a maximum response time for all inputs, thereby eliminating the "focusing" effect. Finally, the system checks each patient's responses against a control to give technicians a reliability index measuring the validity of the results. For example, the system will tell you if a patient is "trigger-happy," thus rendering the results unreliable.
• Standardized: The HACSS delivers a highly standardized and therefore reliable test. Illumination, brightness, contrast and color temperature are standardized. The HACSS conforms to ANSI guidelines for CSF testing at (1.5, 3, 6, 12, 18) cycles per degree. It tests at the ANSI specified light levels of 85 cd/m2 (photopic) and 3 cd/m2 (mesopic) and includes all of the options and parameters the agency requires for contrast testing. Even the testing time is consistently 9 to 10 minutes per eye, with a tighter standard deviation due to the software design and new optotypes. Because the system retains a patient's testing data, follow-up, or tracking tests take only 3 to 4 minutes per eye.
• Integrated: HACSS users have automatic report printing, graphing and output to any media for data collection, and the system is compatible with electronic medical records. With the DataRight feature, technicians can upload data for remote review and analysis. This eliminates transcription and recording errors in clinical trial data and gives doctors near real-time access to data.
All these features put the HACSS at the forefront of a new generation in contrast sensitivity testing.
EMPLOYING THE HACSS
You can make HACSS testing as comprehensive or as fast as you want, depending on the need. But basic testing isn't as fast as using a chart. You might do a test at 6 cycles per degree, have a technician take 3 or 4 minutes to train the patient, give the patient 15 minutes to adapt to low-light testing, and then test each eye for 9 to 10 minutes. At follow-up visits, training is faster and the test takes only 3 or 4 minutes.
Nevertheless, HACSS testing isn't typically part of an annual exam. It's most important use is that of a standardized, automated, integrated test for contrast sensitivity and visual acuity that can be used in FDA studies of drugs or multifocal intraocular lenses. The system also helps us detect and track sensory disorders of the retina or optic nerve. If patient complaints point to cataract, the HACSS helps us determine the source of the complaint immediately.
| Sinusoidal Gratings |
|---|
| Sinusoidal gratings, a repeated number of fuzzy dark and light bars or cycles, are used to create and test the contrast sensitivity curve. The number of cycles of a grating over a specified visual angle determines its spatial frequency. A small number of cycles over a specified visual angle is called low spatial frequency, whereas a large number of cycles over the same visual angle is called high spatial frequency. Contrast is the difference between the brightness and darkness of the grating, mathematically identified by CT = (Lmax-Lmin)/Lmax. Modified from: Ginsburg A; Spatial filtering and vision: implications for normal and abnormal vision. In: Proenza L, Enoch J, Jampolsky A, eds, Clinical Applications of Visual Psychophysics (1981) Cambridge, University Press 70-106. |


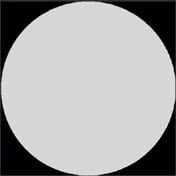
Figures 3 & 4. Patients view a series of optotypes and press one of two buttons to indicate that they see either a bull's eye or a gray disk. |
And of course, the HACSS is an essential tool for evaluating the most common type of contrast sensitivity issue: patients with 20/20 best-corrected vision who still have complaints. Contrast sensitivity often explains the gap between visual acuity and realworld vision, and the HACSS puts patients' contrast sensitivity into a complete and accurate picture.
REFERENCE
1. van Gaalen KW, Jansonius NM, Koopmans SA, Terwee T, Kooijman AC. Relationship between contrast sensitivity and spherical aberration: comparison of 7 contrast sensitivity tests with natural and artificial pupils in healthy eyes. J Cataract Refract Surg. 2009;35:47-56.
Jack T. Holladay, MD, MSEE, FACS is clinical professor of ophthalmology at Baylor College of Medicine in Houston, Texas.


