Guided Progression Analysis makes monitoring glaucoma less art and more science.
By Rene Luthe, Senior Associate Editor
Variety may be the spice of life, but in
glaucoma management, variability has been a serious obstacle to
detecting visual field progression. The threshold sensitivity at a
particular point in a patient�s visual fields can vary � even during the
course of a 5-minute testing period.
Patients with healthy eyes show variability in the sensitivity of their
visual fields. In the visual fields of glaucomatous eyes, the degree of
variability is even greater. To make matters worse, research has shown
that variability increases with the level of damage. �Most clinicians
when they compare one test with the next and see that the most recent
test has some points that are worse, automatically assume that the eye
has progressed,� says Murray Fingeret, O.D., chief of optometry at the
Brooklyn/St. Albans Campus of the Department of Veterans Affairs, New
York Harbor Health System and a clinical professor at the State
University of New York College of Optometry in New York City.
�Unfortunately, this is often not true.�
There is also the problem of the degree of fluctuation varying in
different portions of the visual field. Angelo P. Tanna, M.D., director
of Glaucoma Service at Northwestern University Feinberg School of
Medicine, Chicago, says, �Given this variability or fluctuation in
threshold sensitivity, you would have to spend hours interpreting each
visual field test to determine if the true glaucomatous progression has
occurred.�
Jeffrey M. Liebmann, M.D., a clinical professor of ophthalmology at the
New York University School of Medicine and Director of Glaucoma Services
at Manhattan Eye, Ear and Throat Hospital, agrees. �It�s impossible for
a busy clinician to analyze all the data on a series of visual fields
without an algorithm to help in the evaluation process.�

Rather than wrestling with the question
of whether this variability is due to clinical progression of the
disease, Carl Zeiss Meditec (CZM, Dublin, Calif.) has designed Guided
Progression Analysis (for use with its Humphrey Field Analyzer [HFA] II
perimeter) that detects genuine glaucoma progression, comparing recent
follow-up visual fields tests with a pair of baseline tests, using
detailed empirical data to help reduce the intricacies that have plagued
clinicians.
Baseline Testing
Guided Progression Analysis (GPA) software evaluates the visual field to
determine if deterioration in threshold sensitivity is significant at
each of the 55 to 76 measurement locations. This allows regional
detection of glaucoma, rather than the global progression pattern
standard deviation delivers, says Joel S. Schuman, M.D., F.A.C.S., Eye
and Ear Foundation Professor and Chair of Ophthalmology, University of
Pittsburgh School of Medicine. The software compares the threshold
sensitivity measurements obtained on a follow-up visual field test to
the mean of the measurements obtained on two baseline visual field
tests. Those two baseline visual field tests should be reliable tests
obtained after the patient has scaled the steep portion of the learning
curve. The software uses these baseline tests to look for subsequent
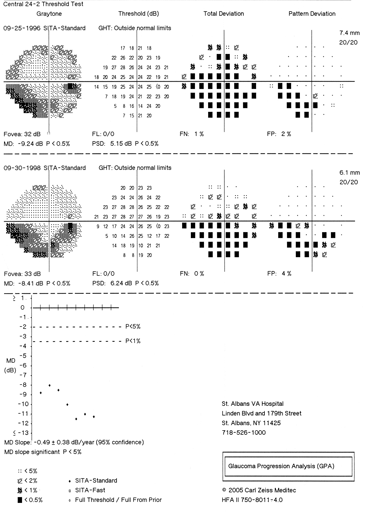
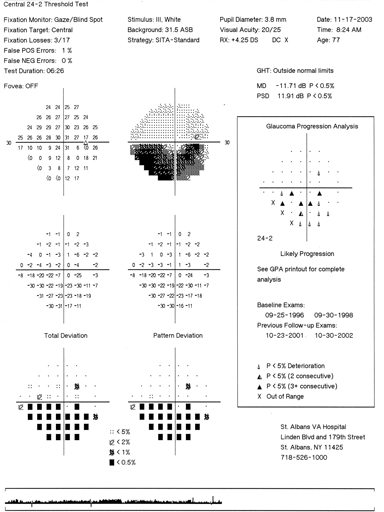
progression at each point (Figures 1-3).

The determination as to whether the
magnitude of deterioration in threshold sensitivity at a particular
point in the visual field may represent clinically significant
deterioration, as opposed to the �normal� fluctuation one expects to see
in glaucoma, is made by comparing the amount of change with a database
of serial visual fields of eyes with stable glaucoma, explains Dr. Tanna.
That database was obtained during the Early Manifest Glaucoma Trial (EMGT).
�The database is based upon individuals with glaucomatous field loss,
not healthy individuals as in the regular SITA database,� explains Dr.
Fingeret. Hundreds of patients were tested four times over the course of
a month, at 16 sites worldwide. The magnitude of acceptable fluctuation
varies mainly as a function of the location of a particular point in the
visual field (more peripheral points fluctuate more than paracentral
points), the degree of damage at the point in question (the worse the
baseline damage, the greater the fluctuation), and the overall degree of
damage in the entire visual field. All of these factors are accounted
for by GPA.

�In the EMGT, the same (not necessarily contiguous) three points in the
visual field had to be significantly worse compared to baseline on three
consecutive follow-up visual field tests for an eye to have met the
visual field criteria for progression,� says Dr. Tanna.
GPA signifies that a point in the visual field has progressed with a
triangle if the deterioration in threshold sensitivity at that point
exceeds the anticipated fluctuation at the 95% significance level. Open
triangles, half-blackened triangles and solid black triangles
demonstrate locations of progression, depending on the number of
consecutive visual field tests in which that point has shown
deterioration compared to baseline. Three half-filled triangles prompts
a warning of �possible progression�; three filled-in triangles brings
�likely progression.�
�In the past, we most often judged a field to have progressed based on
an increased number of significant points on the pattern deviation plot
or an increasing value for the pattern standard deviation,� says Robert
Fechtner, M.D., professor at the Institute of Ophthalmology and Visual
Science, UMDNJ-New Jersey Medical School. �Now we can see individual
points that are likely to have progressed.�

Importantly, GPA relies on pattern deviation data to look for
progression, as opposed to total deviation data. This means that
progressive cataract, for example, is less likely to lead to an
incorrect diagnosis of glaucoma progression. By the same token, in
certain cases the pattern deviation data may remain stable or even
improve, falsely suggesting that an eye is stable despite the presence
of true glaucomatous deterioration.
More Certainty in Less Time
Physicians familiar with GPA agree that it is a great help in monitoring
glaucoma in that it saves the physician valuable time in reading tests
and it allows him or her to winnow out changes that are due merely to
variability.
Guided Progression Analysis does, however, require some adjustments from
those who use it. Dr. Fingeret cautions that doctors must learn a new
assessment technique; GPA requires an evaluation of a series of fields,
rather than a comparison of the test just performed to the previous one.
Dr. Fechtner agrees. �It is a little difficult to change any of our
practice patterns. But GPA software is relatively easy to use and is
backward-compatible with visual fields obtained in the past,� he says.
Dr. Liebmann also offers cautionary advice on its use. GPA can be overly
sensitive, he notes, and no one is really certain of the true definition
of clinically significant change. �Every doctor has a slightly different
threshold,� he says. �Is one triangle important in this particular case,
or two?� Additionally, he cautions, in cases where the visual field
suffers more than 15,000 decibels of loss, the software has
difficulty detecting change because of the high degree of fluctuation.
In these cases, GPA marks the point with an X, indicating inability to
detect damage.
Gaining Ground
Dr. Schuman believes the new degree of certainty GPA provides will
enhance its prevalence. �I�ve always tried to put together structural
and functional measures [of glaucoma progression] for my patients,� he
says. �If I�m going to call it progression, I�d prefer to base that on
both structure and function. But if I�ve got progression in GPA [only],
I�m more comfortable advancing treatment on that basis.� He points out
that it typically takes some time for an innovation to be broadly
adopted by a community. Further slowing GPA�s acceptance, he theorizes,
is that its use requires specific visual field equipment, and that the
software is available from just one manufacturer.
However, clinicians believe the benefits outweigh the drawbacks. �It�s
important to understand that there�s no gold standard for detecting
progression,� says Dr. Tanna. �But GPA is one of the most sensitive and
sophisticated tools that�s currently available. It is based on good
science and it saves me a lot of time.� OM.


