Detecting Glaucomatous
Optic Nerve Changes
We can't afford to miss
diagnostic opportunities that can facilitate timely treatment and improve quality of life for glaucoma patients. Here's what to look for.
By Steven T. Simmons, M.D., Slingerlands, N.Y.
Although we've made progress in establishing guidelines for setting and achieving target IOPs as a goal of glaucoma treatment, we still lack a consistent method for diagnosing glaucoma.
Ideally, we should be able to identify glaucoma in its earliest stages, not by measuring visual field loss, but by documenting changes in optic nerve morphology. By the time patients experience white-on-white field loss, they've already progressed from early to moderate disease. Focusing our diagnostic acumen on the optic nerve can help us detect glaucoma earlier, giving us a chance to prevent progressive visual field loss.
|
Optic Nerve Pathology |
|
The goal of regular ocular screening is to identify patients with preperimetric or pre-visual field loss glaucoma. As we routinely assess patients for glaucoma, we're looking for any of the following early pathological changes:
|
|
Identifying Optic Nerve Pathology
Data from several studies show that we often can detect optic nerve damage before patients have visual field loss (see "Optic Nerve Pathology"). The prospective Ocular Hypertension Treatment Study (OHTS),1 showed that more than 50% of patients with ocular hypertension who developed glaucoma had optic nerve changes without accompanying visual field loss. The same study also revealed that a larger baseline cup/disc (c/d) ratio is a good predictor of subsequent visual field loss.
Additional studies, including histologic evaluations, reinforce the OHTS findings, showing that optic nerve abnormalities, retinal ganglion cell death and defects in the retinal nerve fiber layer (RNFL) precede visual field defects.24 A normal optic nerve has 1.2 million axons. A patient may retain a normal visual field until losing up to 35% -- and sometimes as much as 50% -- of his optic nerve. Studies document that patients can have RNFL damage for up to 6 years before changes in their visual fields are measured.3,4 As glaucoma progresses from optic nerve damage to visual field loss, we can observe a distinct correlation between optic nerve structure and function. Quadrants with fewer axons correlate with regions of greatest field loss.2 Disc rim and RNFL measurements also are directly associated with visual function.5,6 As optic nerve damage progresses, the greatest visual field change is in the quadrant associated with the thinnest neural rim.
Clinical measurements of the disc rim and RNFL thickness correlate quantitatively with visual function in glaucoma.5,6 Unfortunately, a high degree of variability in optic nerve morphology among healthy people can make it difficult to detect early glaucomatous changes. For this reason, we must be especially vigilant when evaluating high-risk patients.
|
|
|
|
|
Measuring Optic Nerve Damage
New technology makes it easier to assess, document and track optic nerve changes. In years past, we made detailed disc drawings and relied on stereo disc photography to document degenerative changes in the optic nerve. Although stereo disc photography is still the gold standard, new user-friendly computerized imaging techniques are providing a unique perspective on assessing and tracking disease progression. (See "Promising New Technologies.")
We can indirectly measure optic nerve damage by evaluating visual field loss. Standard automated perimetry (SAP), also called white-on-white perimetry, detects glaucoma-related visual field loss by measuring sensitivity to white light. The most widely available test, SAP is considered the perimetric gold standard.
A type of short-wavelength automated perimetry (SWAP) (blue-yellow perimetry) targets small, bistratified retinal ganglion cells. (See "Blue-Yellow Short Wavelength Automated Perimetry.") Like SAP, this test measures light sensitivity. However, it uses blue stimuli on a yellow background and may detect glaucomatous visual defects 3 to 5 years earlier than white-on-white perimetry.7 Unfortunately, a complete blue-yellow perimetry test can take between 14 and 18 minutes, and the results may be compromised by media opacities.
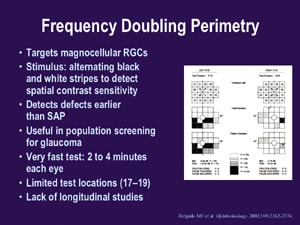
Frequency doubling perimetry (FDP) takes considerably less time than blue-yellow perimetry (2 to 4 minutes per eye) and is useful in population screening for glaucoma. The test, which targets magnocellular retinal ganglion cells, has alternating black and white stripes to detect spiral contrast sensitivity. (See "Frequency Doubling Perimetry.") Although FDP detects defects earlier than SAP, it has only 17 to 19 test locations and limited ability to follow patients over time. The new matrix perimetry uses this technology with 3º targets and may allow us to better follow patients over time.
Dynamic Disease Management
Now that we better understand the relationship between structural optic nerve changes and functional visual field loss, we need to amend our approach to detecting and treating glaucoma. Instead of using visual field loss as an indicator of disease severity, we must monitor and document early optic nerve changes and focus on controlling IOP with potent medications. Most importantly, we need to remember that target IOP isn't set in stone. Glaucoma is a dynamic disease: Preventing visual function loss demands an equally dynamic treatment plan.
Dr. Simmons is co-director of Glaucoma Consultants of the Capital Region in Slingerlands, N.Y. He's an assistant professor at Albany Medical College.
|
Targeting IOP |
How low is low enough for a target IOP? Unfortunately, there's no "safe" IOP that works for all patients. What we do know is that lower IOPs lower the risk of visual field deterioration in glaucoma patients. The Canadian guidelines for glaucoma management recommend target IOPs below 25 mm Hg for suspect glaucoma and 21 mm Hg for early glaucoma, with at least a 20% reduction from baseline IOP.8 (See "Canadian Guidelines: Recommended Initial Target Pressures.") New evidence from published trials812 shows we should set low target pressures, but we can't guarantee that achieving a desired IOP will stop glaucoma's progression. Instead, we must set separate target pressures for each patient and be sure to modify target IOP when necessary. To adjust target IOP, look for direction from clinical guidelines, practical applications of National Eye Institute trials (offered by professional organizations) and the degree and character of each patient's disease.
|
Promising New Technologies
We can't rely on any single machine to diagnose glaucoma, but we can use available technology to gather information leading to accurate diagnoses. Three technologies we can use to assess the optic nerve include:
Heidelberg retinal tomograph
(HRT).
This technology uses a confocal scanning laser ophthalmoscope to create a three-dimensional image of the optic nerve and retina. High-definition images show diffuse and focal retinal nerve fiber layer defects. In contrast, ophthalmoscopic examination with red-free light identifies possible focal defects only. You can also use HRT to compute various disc parameters and determine changes in disc topography. Of the three systems discussed here, HRT offers the best topographic comparisons over time. (See
"HRT II: Progression Over Time.")
GDx nerve fiber analyzer
(GDx).
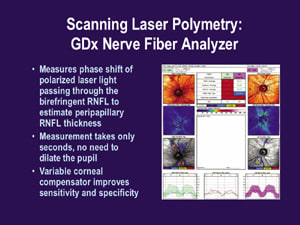
The GDX measures the phase shift of polarized laser light passing through the birefringent RNFL to estimate peripapillary RNFL thickness. This nonmydriatic system returns accurate measurements in only seconds. (See "Scanning Laser
Polarimetry: GDx Nerve Fiber Analyzer.")
Optical coherence tomography (OCT).
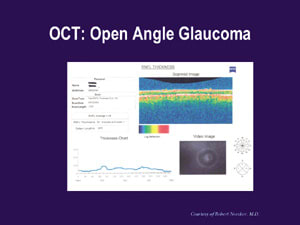
Another useful technology that tracks changes in the RNFL over time by storing still and video images is OCT. Built-in software automatically compares your patients' measurements against those stored in the OCT's normative database, producing charts or graphs that let you detect RNFL abnormalities at a glance. (See "OCT: Normal" and "OCT: Open Angle Glaucoma.")
Our best chance for detecting early signs of glaucoma is to use these technologies in general ophthalmology offices to evaluate patients whose age, IOP or family history puts them at risk for developing glaucoma.

|

|

|

|
|
Staging Glaucoma |
|||
| Glaucoma is currently staged as mild, moderate and severe; however, moderate glaucoma by one scale can be quite different from the same stage on another scale. The following chart shows staging criteria as defined by three different organizations. | |||
|
Glaucoma Staging Criteria |
|||
| Mild | Moderate | Severe | |
| AAO | Showing characteristic optic nerve abnormalities consistent with glaucoma without visual field loss. | Showing characteristic optic nerve abnormalities consistent with glaucoma with visual field loss. | Visual field abnormalities in both hemifields or loss within within 5º of fixation. |
| Canadian Guidelines | Early glaucomatous disc features (cup/disc [c/d] ratio 0.65 or less) or mild visual field defect not within 10º of fixation, or both. | Moderate glaucomatous disc features (c/d ratio 0.70 to 0.85) or moderate visual field defect not within 10º of fixation, or both. | Advanced glaucomatous disc features (c/d ratio 0.90 or greater) or visual field defect within 10º of fixation, or both. |
| Delphi Panel | Characteristic optic nerve abnormalities consistent with glaucoma. achromatic visual fields (white on white). May have abnormal ancillary functional or anatomic test such as FDP, SWAP or optic nerve analysis. | Visual field abnormalities in one hemifield and not Normal within 5º of fixation Optic disc changes consistent with visual field changes. | Visual field abnormalities in both hemifields or within 5º of fixation. |
References
1. Kass MA, Heuer DK, Higginbotham EJ, et al. The Ocular Hypertension Treatment Study: A randomized trial determines that topical ocular hypotensive medication delays or prevents the onset of primary open-angle glaucoma. Arch Ophthalmol. 2002;120:701713.
2. Quigley HA et al. Optic nerve damage in human glaucoma. III. Quantitative correlation of nerve fiber loss and visual field defect in glaucoma, ischemic neuropathy, papilledema, and toxic neuropathy. Arch Ophthalmol. 1982;100:135146.
3. Sommer A, Tielsch JM, Katz J, et al. Relationship between intraocular pressure and primary open angle glaucoma among black and white Americans: The Baltimore Eye Study. Arch Ophthalmol. 1991;109:10901095.
4. Zeyen TG, Caprioli J. Progression of disc and field damage in early glaucoma. Arch Ophthalmol. 1993;111:6265.
5. Airaksinen PJ, Drance SM, Douglas GR, Schulzer M. Neuroretinal rim areas and visual field indices in glaucoma. Am J Ophthalmol. 1985;99:107110.
6. Caprioli J, Miller JM. Correlation of structure and function in glaucoma: Quantitative measurements of disc and field. Ophthalmology. 1988;95:723727.
7. Delgado MF, Nguyen NT, Cox TA, et al. Automated perimetry: A report by the American Academy of Ophthalmology. Ophthalmology. 2002;109:23622374.
8. Kanji KF, et al. Presented at Eye Institute of Ottawa, September 2002.
9. Heijl A, Leske MC, Bengtsson B, et al. Reduction of intraocular pressure and glaucoma progression: Results from the Early Manifest Glaucoma Trial. Arch Ophthalmol. 2002;120:12681279.
10. Lichter PR, Musch DC, Gillespie BW, et al. Interim clinical outcomes in the Collaborative Initial Glaucoma Treatment Study comparing initial treatment randomized to medications or surgery. Ophthalmology. 2001;108:19431953.
11. The Advanced Glaucoma Intervention Study (AGIS): 7. The relationship between control of intraocular pressure and visual field deterioration. Am J Ophthalmol. 2000;130:429440.
12. Comparison of glaucomatous progression between untreated patients with normal-tension glaucoma and patients with therapeutically reduced intraocular pressures. Collaborative Normal-Tension Glaucoma Study Group. Am J Ophthalmol. 1998;126:487497.


