Spotlight
ON TECHNOLOGY AND TECHNIQUE
Solving the Tough Cases
Wavefront using ray tracing may take refractive diagnosis to a new level.
BY CHRISTOPHER KENT,
SENIOR ASSOCIATE EDITOR
Wavefront technology is often discussed in the context of improving the accuracy of custom ablation. Recently, however, some doctors have expressed skepticism about the amount of difference wavefront-guided ablation may actually make. But one thing is clear: Wavefront technology has outstanding potential as a diagnostic tool.
Currently, four different wavefront technologies are in use (though not all of them are FDA-approved):
- Hartmann-Shack, which projects a single beam of light into the eye and measures the returning wavefront
- Tscherning aberrometry, which projects a grid of light beams into the eye and measures the distortion that occurs
- dynamic skiascopy, which projects light into the eye and measures the timing of the returning light
- ray tracing, which projects a single beam sequentially from different locations, with each retinal reflection analyzed separately.
|
|
|
|
The Visual Function Analyzer
(VFA) from Tracey Technologies. |
|
Ray tracing, in particular, seems to be winning favor among many surgeons as the best choice for diagnosing difficult vision problems. This technology is currently available in the Visual Function Analyzer (VFA) from Tracey Technologies.
How it works
The VFA uses a single-beam scanner to measure the optic system at 64 points by projecting each thin beam sequentially through the pupil in 4 concentric circles. (Forthcoming models will measure up to 95 points.) Because this technology uses a single beam to make multiple measurements from multiple locations, it can measure highly distorted eyes -- including most irregular corneas, pseudophakes, and post-op eyes -- that some of the other technologies have difficulty measuring.
The data accumulated by the VFA can be used to evaluate:
- total refractive power of the eye
- lenticular astigmatism
- IOL/ICL alignment
- contact lens/spectacle correction (by measuring with and without the correction. A comparison map shows the difference -- in effect, mapping the corrective lens.)
- accommodative range (via multiple measurements)
- wavefront errors (in lower- and/or higher-order terms)
- pre- and post-surgery comparisons
- simulated best correction
- objective contrast sensitivity, by looking at point scatter on a retinal spot diagram. (The next version, available in January, will provide a numerical measurement of this factor.)
Flexibility and accuracy
The combination of ray-tracing technology and thoughtful product design makes Tracey's VFA very flexible:
Measurement accuracy isn't affected by pupil size. The VFA measures the same number of data points, regardless of pupil size, because it automatically adjusts the proximity of the points being measured to compensate for the diameter of the pupil. (In contrast, Hartmann-Shack technology measures fewer data points when the pupil is narrower).
The area being measured is adjustable. The proximity of the points can also be changed manually, which can help to reveal information about the refractive system. (For an example, see the case history on page 52.)
Programmable data analysis is available with custom software features. This allows you to:
- choose the number of data points you acquire
- place a photographic image of the eye over the wavefront or refractive data maps for reference
- adjust the scale of the data screen (to zoom in or out)
- remove specific aberrations from the wavefront display
- eliminate specific data points from consideration.
The VFA can analyze and integrate outside topographic data. Starting in January 2003, data from an EYESYS corneal topography exam can be integrated with the data from a Tracey VFA wavefront exam, revealing which aberrations are on the cornea and which are not, and what the power of each aberration is. (The handheld Vista unit of the EYESYS system plugs directly into the side of the Tracey VFA.) Software allowing the VFA to integrate data from other manufacturers' corneal topography systems will follow.
|
|
|
|
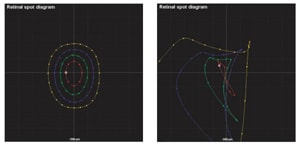
Three VFA measurements (retinal spot diagram, point spread function, and refractive map) of two eyes. The three lefthand maps show spherocylindrical error; the three righthand maps show a patient's refractive status following penetrating
keratoplasty. |
Patient- and user-friendly features
The VFA also has many simple, practical selling points:
A VFA exam is quick. Data is captured in less than 50 milliseconds; a bilateral exam takes less than 1 minute.
Dilation is not required. The VFA measures the same number of data points regardless of pupil size, unless you specify otherwise.
The instrument is easy to use. Once the technician focuses the VFA, it automatically finds the edge of the pupil, determines the locations for the data points and acquires the data. (The technician can do some things manually, such as choose a smaller measurement area.)
The VFA has a broad measurement range. It maps refractive error from +15D to 15D, and pupils up to 8 mm.
You can measure through contact lenses, glasses and IOLs. This makes it possible to determine many characteristics of the corrective lenses.
You can take a measurement even when cataracts or scars are present. The VFA's multiple entry beams can measure through and around pathology, allowing you to override "insufficient data" and measure the data that's still observable.
Displaying the data
You can display data in several formats (see examples, left):
Retinal spot diagram. This shows how the concentric circles of measured data points are offset by the patient's refractive error, providing a "snapshot" of the refractive problem.
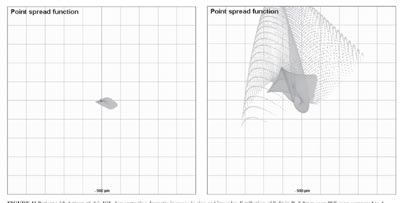
Point spread function. This map simulates how a distant point source of light will look to the patient.
Refraction map. This maps the patient's refractive error within the measured zone.
RMS/Zernike bar display. This quantifies the RMS values for any combination of optical aberrations.
Wavefront deformation map. This is a traditional wavefront map that allows you to isolate or remove the effect of specific aberrations. (Unlike some other instruments, the VFA lets you adjust the scale of these maps.)
Eye image. This can be overlaid on the wavefront or refractive maps for reference.
Comparison function. This allows you to compare
- measurements before and after surgery
- two measurements taken in a row, to verify accuracy
- different size area scans of the same eye.
The screen shows both scans and a difference map.
Visual function and wavefront diagnostic summary. This screen summarizes all displays, showing many of them simultaneously. It includes all exam data, and gives the total RMS for higher- and lower-order aberrations, in percentages.
Comments from the field
Donald R. Sanders, M.D., Ph.D., who runs the Center for Clinical Research and is associate professor at the University of Illinois in Chicago, has studied VFA data from a variety of different practices. "The biggest problem for most M.D.s is patients who come back over and over with vague complaints that aren't in keeping with their acuity, which in some cases may be 20/20 or better," he says. "It's easy to think that a patient like this is just more picky or hard to satisfy. But the problem may be very real, and the VFA can probably detect it.
"Instead of looking at visual acuity," Dr. Sanders continues, "we have to start looking at visual function analysis, or point spread function. This is the map we use the most.
"Some VFA users ask the patient to draw what they see, and then show them this scan, which is usually almost identical. This is a very dramatic patient tool. It not only shows patients that you understand their problem -- which is half the battle -- it also shows that you have the latest technology. From a practice management standpoint, being able to diagnose hard-to-pinpoint complaints like this is big advantage.
"As a diagnostic tool, the VFA is the next order of magnitude past corneal topography. This technology is the next wave."
David Hardten, M.D., director of refractive surgery for Minnesota Eye Consultants and Regions Hospital, and clinical associate professor of ophthalmology at the University of Minnesota, says he finds the VFA to be very versatile. "It's able to image very complex optical problems," he observes.
|
|
|
|
Different size scans (left: 3.7-mm; right: 5.0-mm) of a patient experiencing glare in dim light following implantation of a phakic
IOL. |
|
Dr. Hardten says the VFA helped him resolve a problem presented by a patient who'd received an Artisan phakic IOL. "After taking antihistamines for allergies, the patient experienced more glare in dim illumination. Apparently, the antihistamine was increasing his pupil size.
"We took multiple scans at different sizes with the VFA. Point spread function scans showed a dramatic increase in the size and irregular distribution of light in the larger scan, and refractive scans of a larger area indicated an area superiorly producing abnormal refractive effects. This is consistent with reflections off the edge of the IOL optic." (See images, above.)
Brian R. Will, M.D., of Will Vision & Laser Centers in Vancouver, Wash., has used the Tracey system for more than a year. "The VFA works really well," he says. "It's quite accurate when it comes to diagnosing patient disorders. The real strength lies in its ability to measure any eye, whether it's virgin, post-op, or has significant irregularities."
Dr. Will is quick to point out potential shortcomings. "The major limitation of the VFA may be the relatively small number of data points it measures. On the other hand, it remains to be seen whether we really need greater accuracy than this."
He also says he'd prefer to wait a while before using the VFA to guide an ablation. "The wavefront machine needs to be matched to the customized excimer laser treatment profile using internal nomogram adjustments, based upon feedback from real-world patient data. The VFA hasn't been around long enough for this kind of integration to occur. But it's very valuable for analysis, much superior to some other wavefront instruments I've used."
For more information
To find out more about the Tracey Visual Function Analyzer, contact Tracey Technologies at (281) 445-1666, or send an e-mail to info@traceytech.com.
Are you aware of new products or technology that have made (or are likely to make) a significant difference in practice? Contact Christopher Kent at kentcx@boucher1.com to find out about possible coverage in a future issue.


